Digital twin · Operations
Every site leaks money where nobody is looking
The answer is usually already in your systems. It sits in six of them that never talk to each other. An operational digital twin joins them on one model of the asset and puts a price on what is holding it back today.
The problem: six systems, no single answer
Ask an operations director why output was short yesterday and you get a meeting, not a number. The building management system shows one thing, the work-order system another. Contracts, meters, the historian and the cameras each hold a piece of the story, and each team defends its own screen.
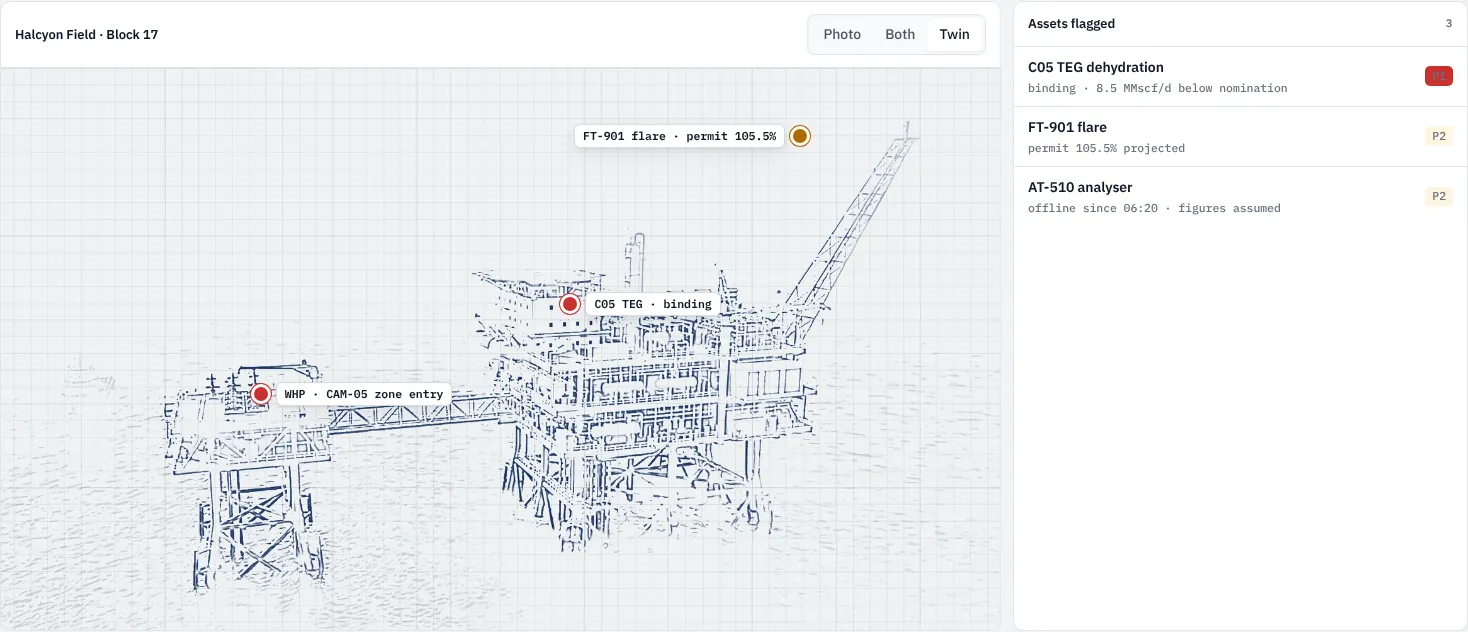
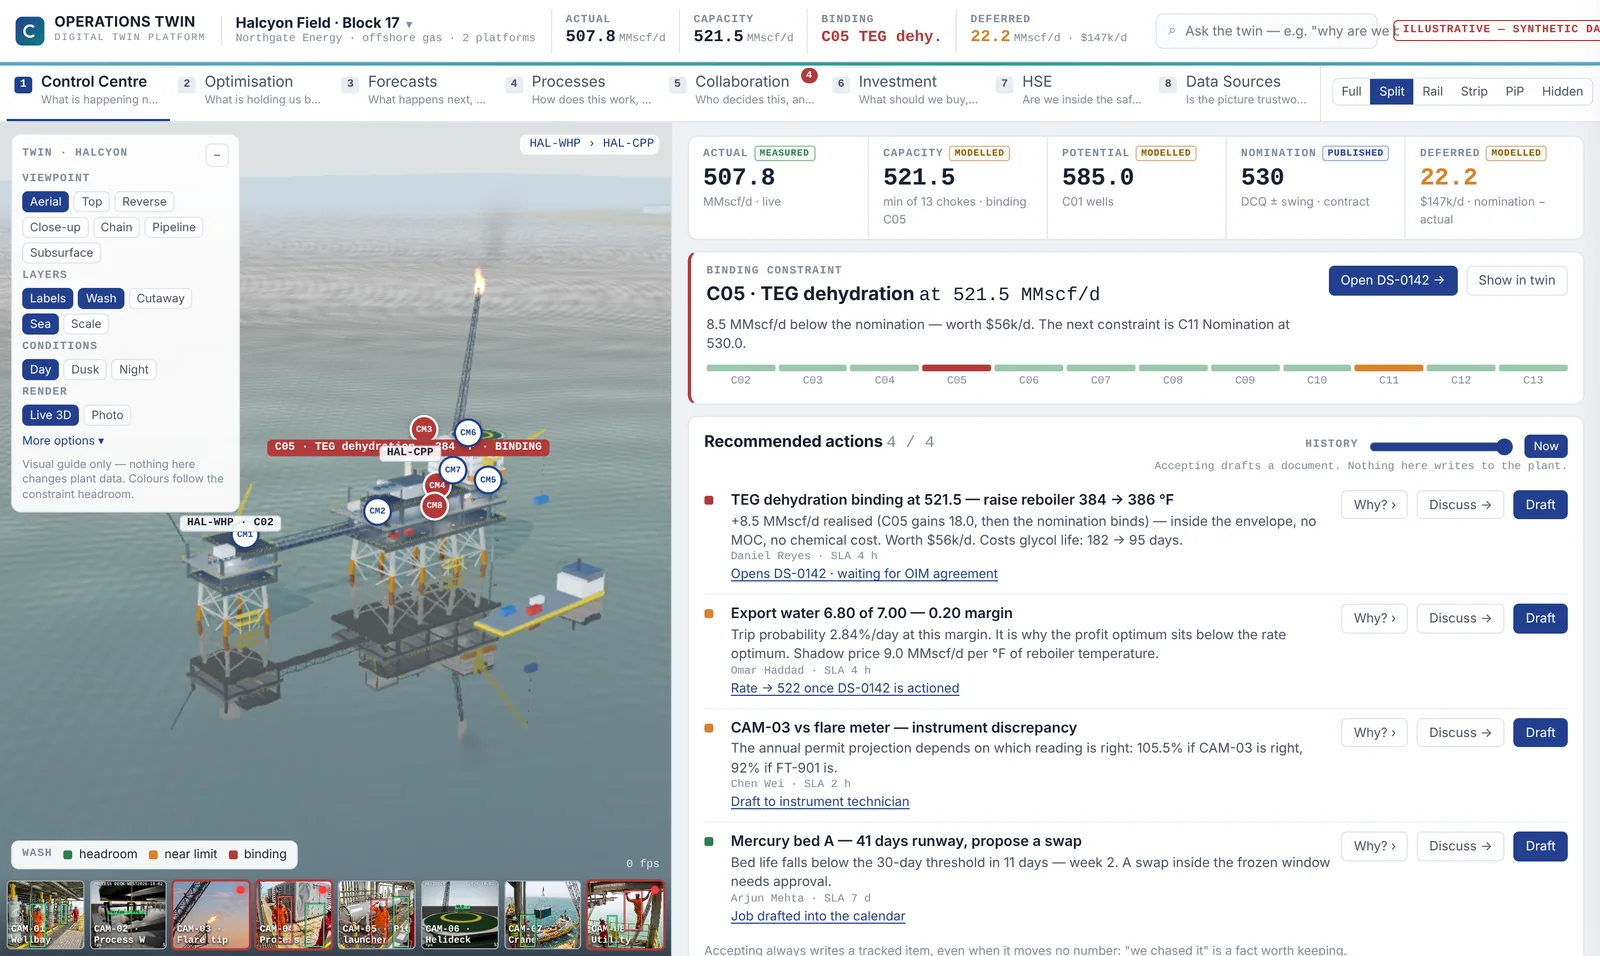
Meanwhile the cost of the delay never appears on any report. A gas field runs below nomination because one dehydration unit is the limit, and in the demo that gap is worth $141k a day. A hotel sells room nights outside its comfort band and pays the FM contract credits for it. A logistics hub pays carriers to wait. None of these losses is hidden on purpose. They sit between the systems, where nobody owns them.
The data to catch the problem usually exists. Nobody joins it up in time.
Who this is for
Synopton is built for the people who answer for an operating asset's results:
- Operations, asset and estates directors at mid to large companies
- FM and engineering leads who run the daily meeting
- Owners and portfolio managers who need one view across several sites
It fits assets that cannot stop: offshore platforms and terminals, hotels, office towers, construction sites, data centres, hospitals, factories, districts, rental portfolios and logistics hubs.
What the twin does
Synopton builds a live 3D digital twin of one asset and connects it to what you already run. The twin does six jobs, in this order.
- Connect. Read-only connectors to the BMS and metering, SCADA and historians, CMMS work orders, ERP and contracts, IoT sensors and CCTV, over OPC UA, BACnet, Modbus, MQTT, REST and RTSP.
- Normalise. Every reading is mapped to an asset, a unit, a timestamp and its source. Gaps and bad values are flagged, never silently filled.
- Model. The 3D twin loads your BIM (IFC or GLB) or is built from drawings and equipment lists. Sensors, cameras and work orders get a place on the asset.
- Detect. Computer vision runs on the cameras you already have. Each detection is stored as evidence with a camera, a time and a confidence score.
- Decide. Versioned rules hold your constraints, SLAs and permits. Each recommendation is priced per day of delay, and accepting one drafts a decision record with an owner and a deadline.
- Deploy. In your own cloud tenancy or hosted by us, with single sign-on, role-based access and an audit log of every answer and decision.
Nothing writes back to plant or building systems. The twin advises, people decide.
Why your team will believe the numbers
Nobody trusts a figure on a dashboard they cannot check. So every figure in Synopton carries one of five labels: measured, modelled, published, assumed or forecast. One click on Why? opens the inputs, the rule version, the sources and the reasoning steps behind it.
When a sensor drops out, its figures switch to assumed, and the twin tells you which decisions not to take while it is blind. That one rule settles more arguments in a morning meeting than any new dashboard.
You can also ask the twin in plain English, for example "why are we below nomination?". The answer comes only from the twin's own data, and every claim links to its evidence. Answers that cannot be cited are not shown.
See it running
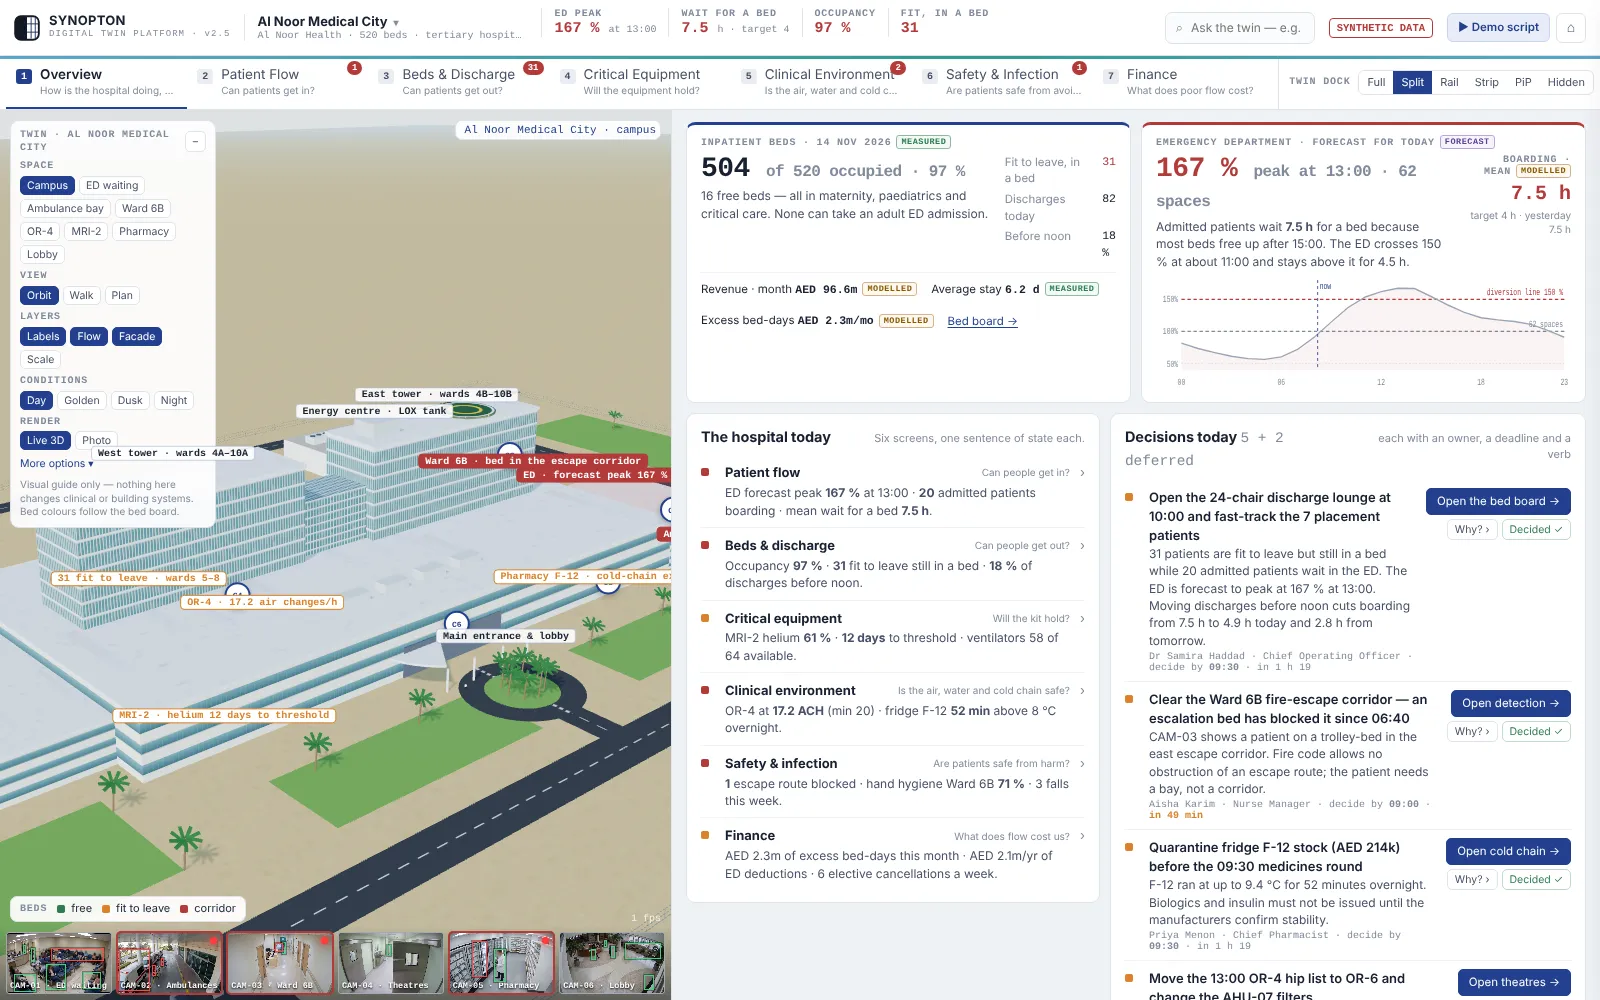
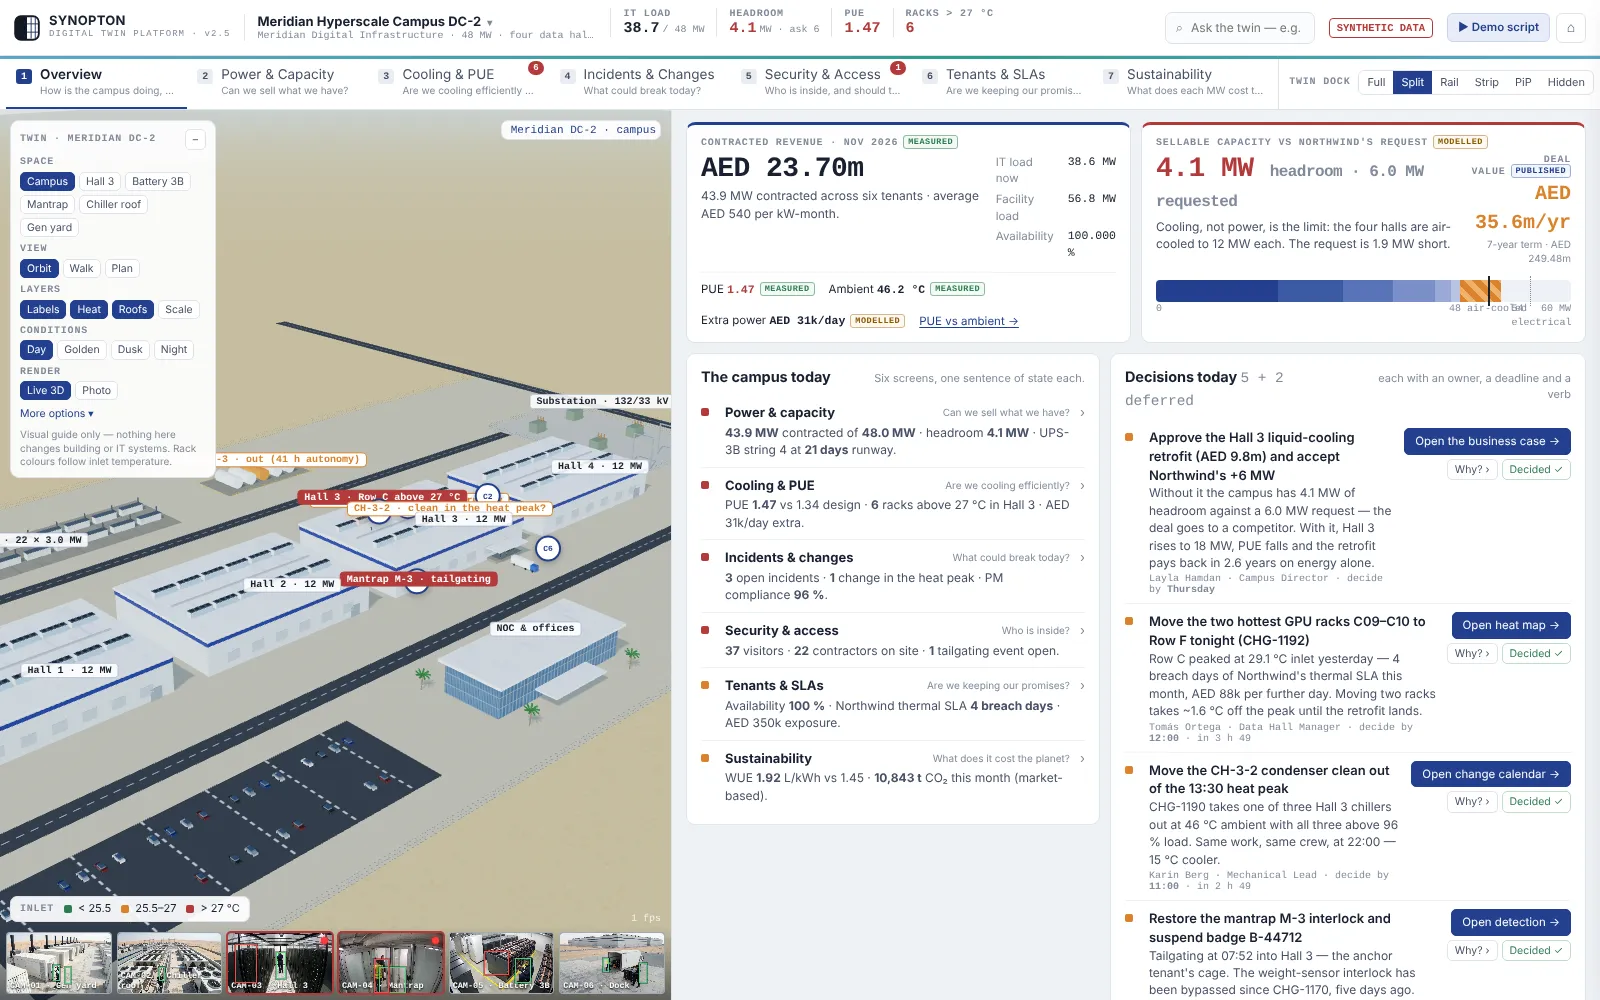
You do not have to take this on trust. The interactive demo has eight fully built twins: an offshore gas field, a 402-room hotel, a 48 MW data centre, a 520-bed hospital, a brake-parts plant, a waterfront district, a rental portfolio and a 3PL logistics hub. Each comes with a guided script you can present from.
The live console shows four sites on demo data at once, with cameras, a decision board that replays a whole shift and Ask the twin. Demo names and figures are illustrative.
What it costs
We quote after a 30-minute scoping call, because the price depends on the number of assets, data sources and cameras.
- Pilot. One asset, your own data, a fixed fee agreed at scoping. If you continue, the fee is credited against your first year.
- Site. An annual subscription per asset, scaled by connected sources and cameras, with model updates and support included.
- Portfolio. One agreement across many assets, with a shared model library and group-level reporting.
The pilot answers one question: does the twin find money and risk your team can act on? You choose the asset. See how the pilot works.
Start with one asset
Pick the site that costs you the most sleep and the one question it has to answer. Send it to info@synopton.com, or book a scoping call. You get the full demo straight away.
Questions buyers ask
Do we need a BIM model?
No. We build the 3D twin from layouts, drawings and an equipment list. If you have BIM, IFC or GLB models, we load them.
Does Synopton control any equipment?
No. Connectors are read-only. Accepting a recommendation drafts a decision record for people to agree; nothing is written back to plant or building systems.
Our data is messy. Is that a problem?
It is normal. Anything we cannot measure is labelled as assumed, so nobody mistakes an estimate for a reading, and the data health screen shows where the gaps are.
Can it run in our own cloud?
Yes. Hosting, data residency and retention are agreed during the pilot and written into the contract.
Your site, your data
Want to know what your site is losing?
Tell us the asset and the question it has to answer. You get the full demo straight away, and we come back within one working day to book 30 minutes.