Data centres
A data centre digital twin that tells you what you can sell.
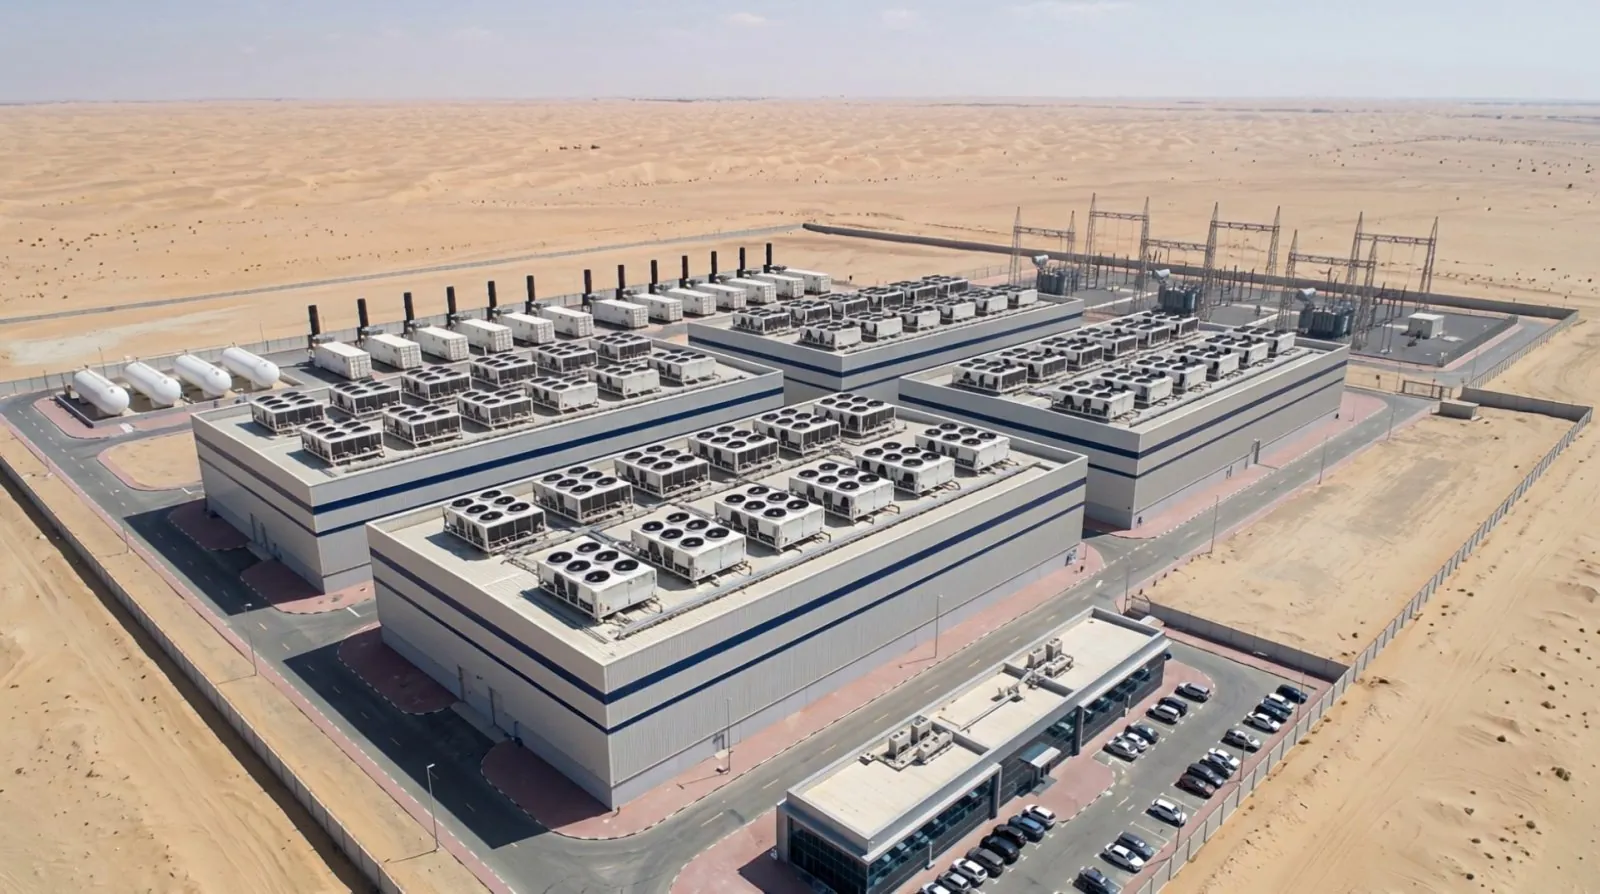
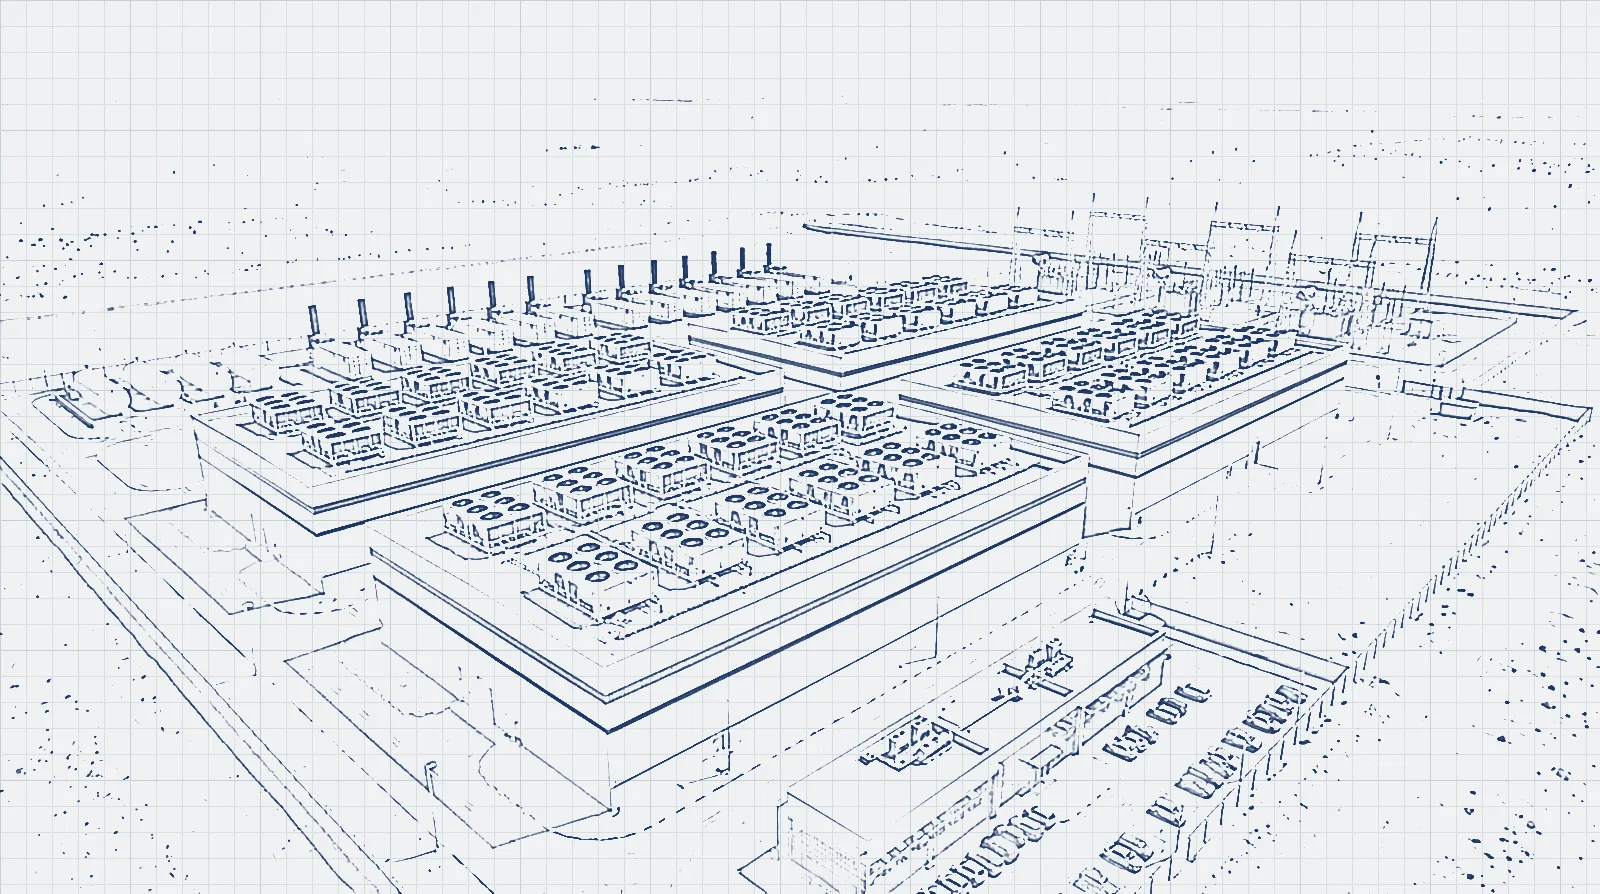
Synopton builds a live 3D twin of your campus and connects it to the BMS, DCIM, UPS and battery monitoring, billing and access control. Every rack, chiller and tenant contract sits on the asset it depends on, with a price attached.
Why capacity goes unsold
Colocation and hyperscale campuses sell power and cooling by the megawatt.
A tenant asks for 6 MW more, and nobody can give a firm answer before the term sheet expires.
The answer is spread across the single-line diagram, the BMS, DCIM and billing. Electrical capacity says yes. Air cooling says no, and in a heat wave that limit moves every afternoon. Meanwhile PUE drifts above design, thermal SLA credits build up on one row of GPU racks, and a chiller clean gets booked into the hottest hour of the week. Each cost is small on its own report and large once joined up.
What the data centre twin watches
Every signal is tied to a hall, a row, a rack or a piece of plant.
The twin watches
- Sellable headroom per hall: electrical against cooling
- Rack inlet against each tenant’s thermal SLA
- PUE and WUE priced at the tariff, hall by hall
- UPS strings, generators and fuel autonomy with a runway
- Changes scheduled against the weather and plant load
- Mantraps, escorts and arc-flash PPE on camera
Decisions it drives
- Whether a capacity request fits, and what makes it fit
- Which retrofit pays back first
- Which change moves out of the heat peak
- When to order batteries inside the lead time
How it works in a data centre
Read-only connections, a 3D model and a record of every decision.
- Connect. Read-only links to the BMS and EPMS, DCIM and rack PDUs, UPS and battery monitoring, the CMMS and change calendar, billing and tenant contracts, access control and CCTV.
- Model. A 3D twin built from the basis of design, single-line diagrams and rack layouts, or loaded from your BIM, with halls, plant and cameras placed where they really are.
- Label. Every figure carries a provenance chip (measured, modelled, published, assumed or forecast) and a Why? panel that shows its inputs.
- Ask. Plain questions such as “can we take Northwind’s 6 MW?” come back with answers that cite the twin’s own data.
- Decide. Accepting a recommendation drafts a decision record with an owner and a deadline, and the twin then tracks the measured result.
See a data centre twin running
Meridian Hyperscale Campus DC-2, in the demo.
Meridian Hyperscale Campus DC-2, 48 MW across four data halls and six tenants, is fully built in the interactive demo. On day 6 of a heat wave PUE runs at 1.47 against 1.34 design, and six racks in Hall 3 Row C sit above the 27 °C thermal SLA. The anchor tenant, Northwind AI, asks for 6 MW more. Headroom is 4.1 MW: power is not the limit, air cooling is. The twin prices an AED 9.8m liquid-cooling retrofit of Hall 3 that adds 6 MW, pays back in 2.6 years on energy alone and wins a deal worth AED 35.6m a year.
IN THE DEMODemo names and figures are illustrative.
Questions buyers ask
Do we need a BIM model of the campus?
No. We build the 3D twin from the basis of design, single-line diagrams, rack layouts and an equipment list. If you have BIM, IFC or GLB models, we load them.
Does Synopton write to our BMS, EPMS or DCIM?
No. Connectors are read-only. Accepting a recommendation drafts a decision record for people to agree; nothing is written back to building or IT systems.
How are tenant data and camera footage handled?
Tenant names and badge records are masked by default. Camera detectors flag events such as tailgating at a mantrap; faces are never stored, and revealing a name is written to the audit log.
How soon is the twin useful?
The twin is usable from week six of a 90-day pilot, and your team runs real decisions through it in weeks seven to twelve.
Other industries
The same platform runs twins of other assets that can’t stop.