Offices · Energy
Floor 18 is fully cooled. Almost nobody is there.
Lease hours end at 19:00. The air handlers often do not. An office twin puts occupancy, HVAC runtime and metering on one model, so you can see which floors are cooled for nobody, what that costs, and which tenant it belongs to.
The problem: the schedule and the building disagree
Every office lease names its hours. The BMS has a schedule that is meant to follow them. Then a tenant asks for a late night before a deadline, a facilities engineer extends the schedule, and nobody takes the extension out again. Months later the air handler on that floor is still running at full speed into the evening.
Nobody sees it because the evidence is split across systems. The BMS knows the fan speed. Access control knows who badged in. The meters know the energy. The lease system knows the hours each tenant pays for. Each team looks at its own slice and each slice looks reasonable.
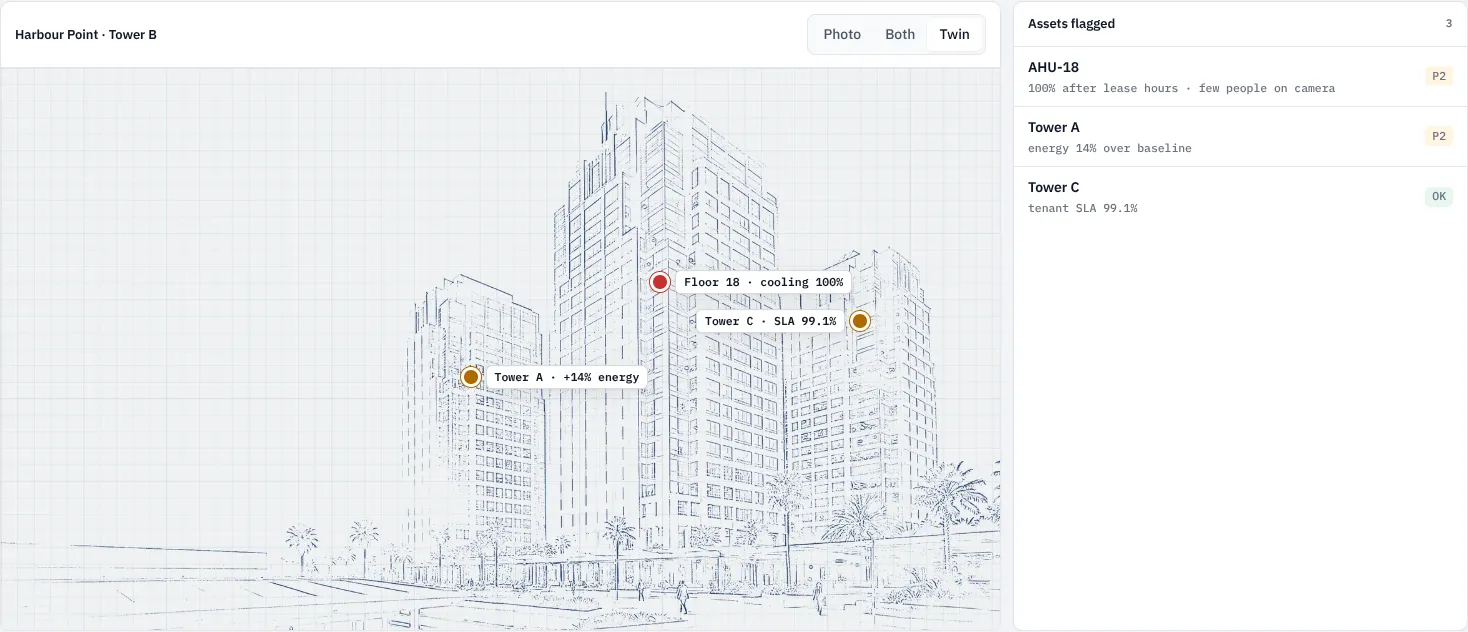
The demo office, Harbour Point Tower B, shows the pattern. Lease hours are 08:00 to 19:00. At 19:40 the air handler AHU-18 is still at 100 % fan speed on floor 18, the cooling load on that floor is 412 kW and the camera on the floor counts only a few people (demo figures). Across the site, Tower A is running 14 % over its weather-normalised energy baseline.
An empty floor at full cooling is not an energy problem. It is a schedule problem that shows up on the energy bill.
Who this is for
- Portfolio and asset managers who own the energy line and the service charge
- Building and facilities managers who run the BMS schedules
- Energy and sustainability leads reporting intensity per building
- Property managers who recharge energy and after-hours use to tenants
What the twin joins up
Synopton builds a live 3D twin of each building and connects read-only to what is already there: the BMS and the meters, access control and occupancy sensors, the CMMS, the lease and service-charge data, and BIM or as-built drawings. Existing cameras can add a people count per floor.
Put on one model, those sources answer questions that no single system can:
- Which floors are conditioned outside their lease hours, and for how many people.
- How much cooling that took, per floor and per tenant, against an occupancy-matched profile.
- Which tenant requested the extension, and whether it was ever recharged.
- Which building in the portfolio is drifting from its baseline, and why.
On the Harbour Point model, floor 18 carries a red pin, "cooling 100%". The asset list beside it reads "AHU-18 · 100% after lease hours · few people on camera".
From a running fan to a set-back
The demo replays one evening. At 19:00 lease hours end and every system is reporting. At 19:40 floor 18 is still fully cooled for a handful of people. At 19:41 the twin prices a set-back and shows its working. The recommendation is to set back floors 15 to 20 from 19:30 on weekdays, estimated at 9 % less cooling energy on those floors, owned by the portfolio engineer, for tonight.
The engineer sets the schedule in the BMS at 19:46. The twin reads it back and confirms it. AHU-18 drops from 100 % to 35 %, and the cooling load starts falling toward the occupancy-matched line.
Tower A gets a different answer, because its cause is different. There the twin traces the 14 % to the plant: the AHU-A2 filter pressure drop is 310 Pa against a change point of 300, and the chilled-water temperature difference is 3.1 °C against a design value of 5.5. The action is to change the filters and rebalance the chilled-water loop, owned by the maintenance contractor.
Energy per tenant, not per building
A building-level energy figure hides who is using it. Once metering, lease hours and access data sit on one model, the twin can show energy intensity per building and per tenant, and separate the hours each tenant pays for from the hours the plant actually ran for them.
That changes three conversations. The service-charge reconciliation uses measured runtime instead of an estimate. After-hours requests become a line that can be recharged. And when a tenant complains the floor is too warm, the twin shows whether it is an asset fault or a schedule, before anyone is sent up.
Why the numbers hold up
Every figure in Synopton carries a provenance label: measured, modelled, published, assumed or forecast. Press Why? on the set-back and the panel lists its inputs. The people on floor 18 come from the live camera count (measured). AHU-18 fan speed at 100 % is measured from the BMS. Lease hours of 08:00 to 19:00 are published, from the lease. The 9 % saving is modelled, under rule EN-SB version 3.0.
Ask the twin "where are we wasting cooling?" and the answer cites its sources line by line, so a figure can be checked before it goes into a board pack.
The twin also does not touch your plant. Connectors are read-only. It recommends a set-back and drafts a decision record; a person makes the change in the BMS. A data health screen says which meters or sensors have gone quiet, so a silent meter is not mistaken for a saving.
See it running
The live console has Harbour Point on demo data next to a hotel, a construction site and an offshore field. Open the Twin tab and choose Harbour Point to see floor 18, Tower A and Tower C pinned on the model, then read the decision board for the 19:46 set-back. The office page covers what an office twin watches across a portfolio, and the platform page explains how a figure becomes a decision record.
What it costs
We quote after a 30-minute scoping call. The pilot runs on one building with your own data for a fixed fee agreed at scoping, credited against the first year if you continue. After that, Site is an annual subscription per asset, scaled by the number of connected sources and cameras, and Portfolio puts many buildings under one agreement with group-level reporting. See how the pilot works.
Find the floors you are cooling for nobody
Send us the building or the portfolio, your BMS and the meters you have. Email info@synopton.com or book a scoping call, and you get the full demo straight away.
Questions buyers ask
Does Synopton control our HVAC?
No. Connectors are read-only. The twin recommends a set-back and drafts a decision record; your team changes the BMS schedule.
Do we need cameras on every floor?
No. Access control, occupancy sensors and metering already show most after-hours use. Existing cameras can add a people count where you have them.
Can we start with one building?
Yes. A pilot covers one building with your own data. If you continue, the pilot fee is credited against your first year.
Do we need BIM?
No. We build the twin from layouts, drawings and an equipment list, and load BIM, IFC or GLB models where you have them.
Your site, your data
Want to see which of your floors are cooled for nobody?
Tell us the asset and the question it has to answer. You get the full demo straight away, and we come back within one working day to book 30 minutes.